Why and how to manage high-level data?
Friends and colleagues,
Welcome to the first issue and thank you for subscribing!
Every Friday, I will write about supply chain management. It will be experimental. My first goal is to share what I learned, and I've been applying daily at work - hoping that it may be helpful for you. I, for sure, don't have all the answers or not yet close to be an expert. But learning excites me, and I hope I can also learn from you.
I want to start with the basics - managing the high-level data.
A year ago, I asked my team if they knew how many cases we shipped to our customers year-to-date. After making multiple educated guesses and some help, they were finally getting close to the actual number. Supply chains are all about complexity and getting the details right, where the team spent a lot of time. It reminded me that it is essential to know your top-level numbers and their progress over time. If we don't know our numbers, we will most likely miss something.
People who work with me closely will know that one of my favorite words is "routine." Perhaps tied to my personality, I believe establishing routines help you progress. Tracking your key metrics and numbers can be the easiest and most powerful action you can take next Monday to improve the work's output and quality. You can set up this routine by putting in 15-30 minutes of weekly effort, e.g., Monday mornings. I have witnessed some colleagues who built this habit, and they moved-up fast in their careers.
Why make a routine to review your key numbers?
You will be on top of your game.
You will be more proactive.
You will prevent problems from happening.
You will solve problems faster.
Another side effect (which should never be the goal) is that the organization’s leaders will be impressed when you confidently talk about your numbers on-the-go rather than sending them a follow-up e-mail.
The simplest descriptive statistics that you can use on a spreadsheet
Minimum and Maximum: Minimum and maximum values of your dataset.
Average:
Mean: The simple average of your dataset (Watch out for outliers)
Median: The middle point of your dataset (Reduces the impact of outliers)
Moving Average: Mean of last N periods to see the latest trends
Standard deviation: The dispersion of the data around its mean.
Coefficient of variation (CV): Ratio of the standard deviation to the mean. The result will be a value between 0 and 1. The lower the CV, the less is the variability.
Get better in monitoring and speaking percentages (%)
Be prepared to describe your top SKUs in % - some examples of practice are below:
What % does SKU X or customer X represent in total cases shipped?
What % does SKU X represent in our average $ inventory?
What % does supplier X represent the total spend?
Master to speak increase and decrease vs. previous periods in %.
Which SKUs to start with?
Ask yourself which SKUs will cause the company trouble - if there is an issue? (I will talk about the importance of the ABC analysis later on) Some problems can be underselling (obsolete risk), overselling (out of stock risk), or supply issues (out of stock risk). For example, at Heinz, we were not allowed to go out of stock with a handful of top-selling SKUs. (I bet you can guess which ones :))
Most likely, your selection will be the highest-volume SKUs - but not always.
Some metrics to track
Volumes (in cases and dollars)
Inventory (Average or ending value)
Service levels (including case fill rates and on-time delivery)
Obsolete inventory in dollars
Forecast error %
Contract spend
You can further segment the data by customer and supplier.
Set-up yourself a spreadsheet
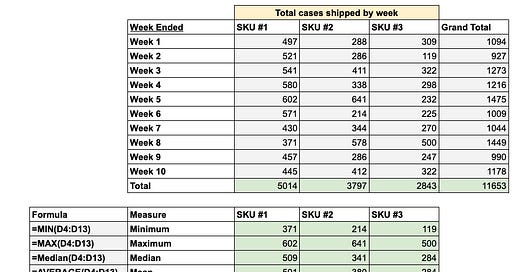
Here is a screenshot of a sample set-up on Google sheet. Let’s wrap-up with an example.
Suppose you track your weekly case volumes for your top 3 SKUs as below. These are SKUs that you can not go out of stock. You are at the beginning of Week 12. You ran Week 11 numbers.
Can you see a concerning point in Week 11 numbers?
SKU#1 on Week 11 sold 800 cases, significantly above the maximum and last 3 weeks average.
The increase in sales is great for the company, but this should be a concern for the supply chain teams unless it was planned. If you are on top of your data, you can immediately investigate what caused the uplift and take action for the next steps.
Weekly challenge:
If you aren’t tracking your key metrics, start next Monday and be consistent. Managers, check-in with your team by asking about their data. Make it fun and guide them in the right direction.
Thank you for being part of the supplychainist and have a great Friday :)
Next Friday, I will write about how not to waste your time required to make a detailed analysis.
To receive this newsletter in your inbox weekly, consider subscribing:


