Hello! I’m Caner, and welcome to my newsletter - SupplyChainist. Every Friday, I humbly write about subjects within supply chain management. By subscribing to the newsletter, you will get the weekly new edition to your inbox about the approaches that I discovered and keep learning to help you make smarter supply chain decisions.
Good morning!
Last week, I wrote about how supply chain decisions and performance impact balance sheets and liquidity. Mid-level managers’ short and medium-term planning and decisions will impact current assets and current liabilities, significantly impacting the companies’ liquidity position. Working capital and cash-conversion-cycle are two important liquidity metrics to take a snapshot of companies’ short-term financial health.
Today I want to increase focus on Cash-Conversion-Cycle (CCC), which is an asset management ratio that attempts to measure (in days) how long each net dollar input is held up in production, inventory, and sales before it gets converted into cash. 1
CCC is a valid metric for industries and companies that rely on inventory to generate revenue. That’s why supply chain teams should understand calculating and reading this asset management metric. You also want to track this metric over time, rather than looking over a single quarter result to make an assumption or take a decision.
Quick CCC Recap
CCC = Days of Inventory Outstanding + Days of Sales Outstanding - Days of Payables Outstanding
Days of Inventory Outstanding = Average Inventory/COGS
On average, how many days it takes to convert the inventory into sales.
Days of Sales Outstanding = Average Accounts Receivable/Sales
On average, how many days it takes to get cash from customers.
Days of Payable Outstanding = Average Accounts Payable/COGS
On average, how many days it takes to pay suppliers.
The average inventory, accounts receivable, and accounts payable are calculated as (beginning value + ending value)/2.
The shorter the CCC, the more liquid the company is. The longer the CCC, takes more time the company to get cash. As demonstrated in last week’s PepsiCo Example, CCC can be negative, which is the best scenario for its liquidity. Negative CCC means a company pays vendors after it converts inventory into sales and collects cash from customers.
Last week, I demonstrated how PepsiCo increased its days of payables outstanding during the last 8 years. Some companies, and industries, especially e-commerce players, have negative CCC from Day 1. Why? Because they collect cash instantly from customers as soon as the checkout process is completed.
Let me build on the PepsiCo example and compare how Coca-Cola, Procter & Gamble, and Mondelez International perform. It makes sense to compare the CCC of these companies as globally dominant players and operate in the food and beverage industry.
2020 Cash Conversion Cycle Comparison
Key highlights:
PepsiCo, P&G, and Mondelez are operating in negative cash-conversion-cycle
It takes Mondelez, on average, 136 days to pay its vendors. (At this figure, I can make the assumption Mondelez suppliers can’t be happy)
PG collects cash from their customers the fastest. 23 days. (All other companies are above 30 days.)
PepsiCo, on average, holds the least amount of inventory on hand to generate sales. (Impressive that they generate $70 billion by holding an average of 43 days of inventory on hand)
1) PepsiCo
Maintained days of inventory and sales outstanding
Increased days of payables
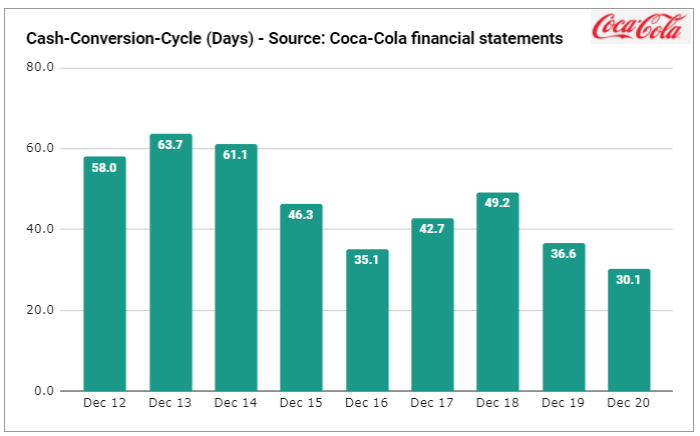
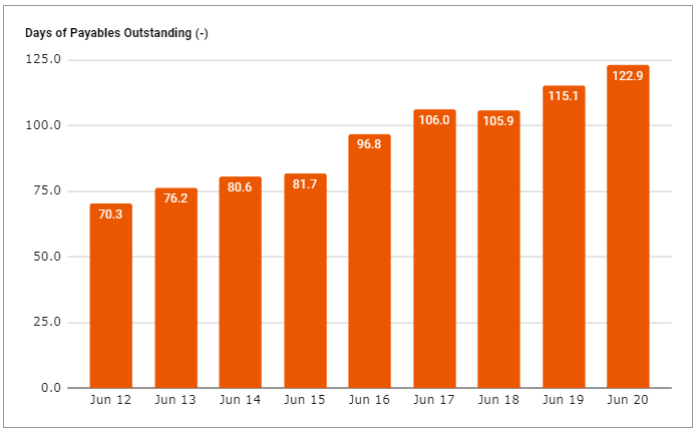
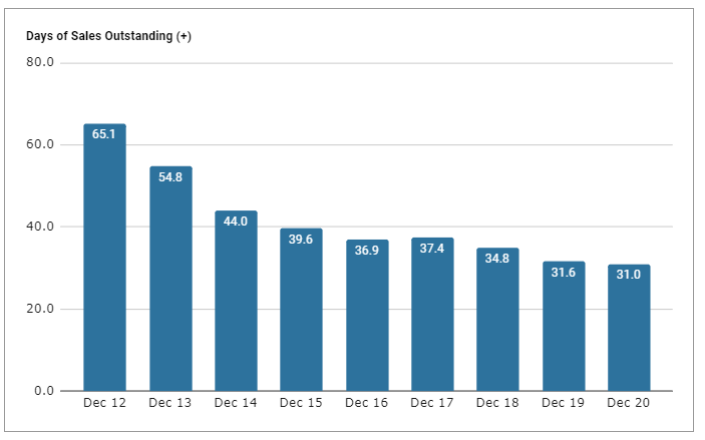
2) Coca-Cola
Maintained days of sales outstanding
Days of inventory and payables both increased and offset each other
3) Procter & Gamble
Slightly Reduced days of inventory and sales outstanding
Significantly increased days of payables
4) Mondelez
Maintained days of inventory
Constantly reduced days of sales outstanding and increased days of payables outstanding.
Based on financial data, it seems a common theme that these billion-dollar businesses leverage their buying powers to push out vendor payments as much as possible as a way to improve company liquidity.
Summary:
Cash-Conversion-Cycle is a liquidity metric which supply chain can directly impact.
Track the Cash-Conversion-Cycle (CCC) to compare your company to competitor’s position and industry average over time.
The shorter the CCC, the more liquid the company is.
The longer the CCC, the longer time the company requires to generate cash.
A company will have negative CCC when it converts its inventory into cash faster than pays its vendors.
Companies may have different goals that translate into different results.
Want to see the full calculations? You have access to the SupplyChainist spreadsheet here: Cash Conversion Cycle Analysis.
Important supply chain reads:
Suez Canal blocked - 50 container ships pass a day and already 200 ships backlogged - Source: CNBC (This incident will likely impact North America in few months)
How long is the Ever Greens ship likely to be tucked? Source: Time
Thank you for being part of SupplyChainist, and have a great Friday :)
If you liked this issue and found it valuable, consider sharing it with friends:
If you haven’t subscribed to it yet, subscribe now:


Hello, do you have any plans to restart this weekly newsletter? I'm currently studying supply chain and logistics, and your weekly posts have been very insightful.